
SIGNAL INTAKE // PRE-LAUNCH
Get in early.
Join the waitlist. Be first to measure.
›
Encrypted · No spam · Unsubscribe anytime
Speech you can measure.
What they said. How they said it.
Observational analysis only. Not a fact-check.
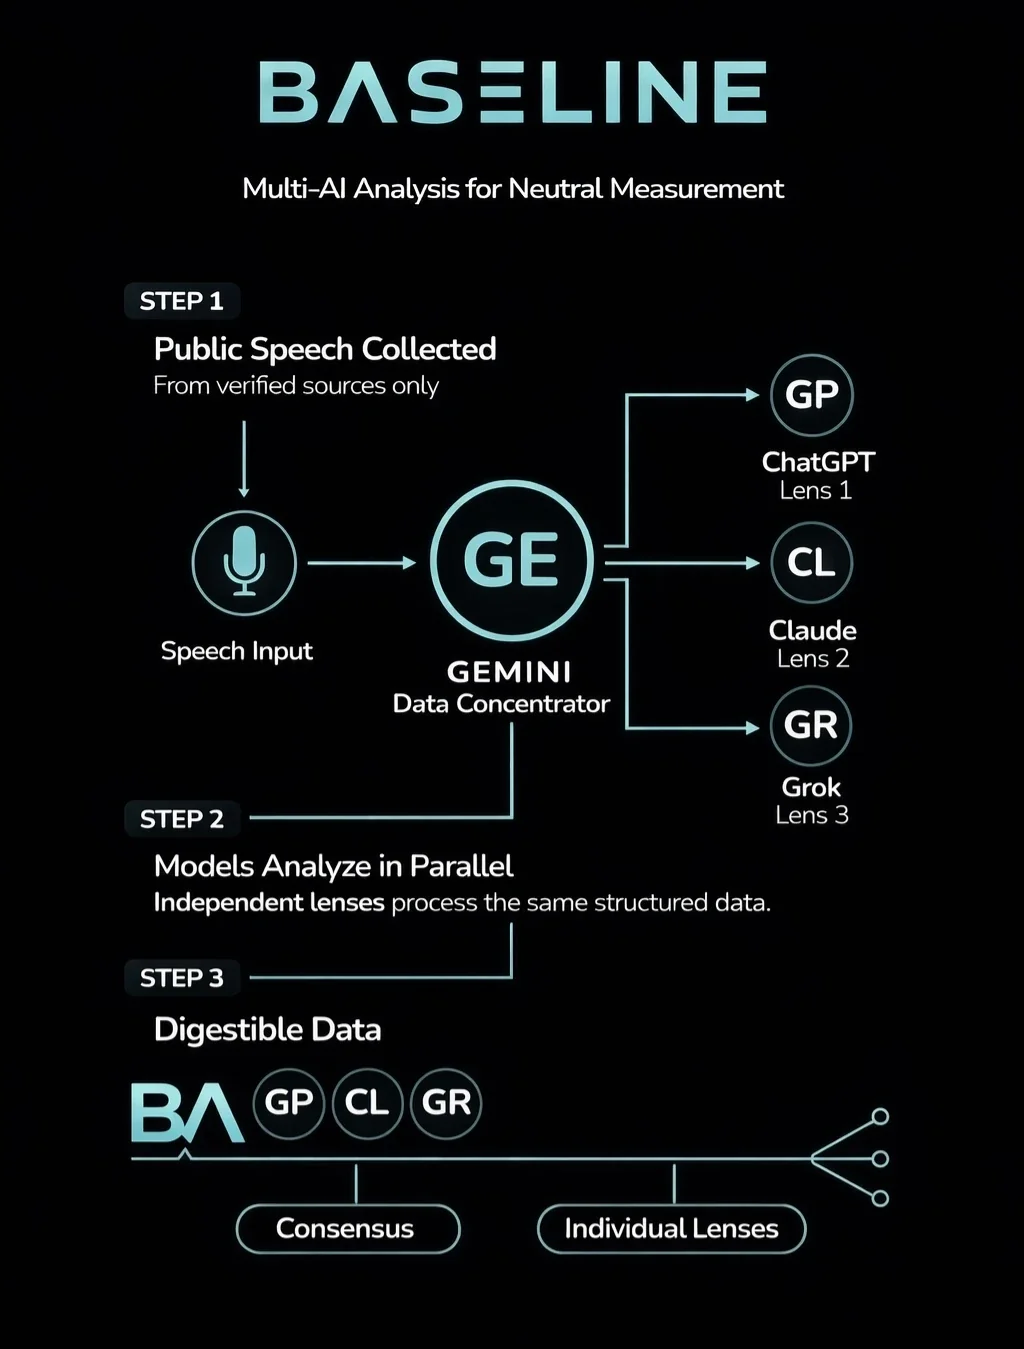
Same input•Parallel systems
Side-by-side results with source context
1) Ingest
Public statements captured with source, timestamp, speaker, and context.
2) Analyze independently
Multiple AI systems process every statement in parallel. No model sees another’s output. Variance stays observable.
3) Display side-by-side
Results displayed together with a separate consensus result. Sources and context on every screen.
Pipeline
CLASSIFIEDFULL PIPELINE · PRE-LAUNCH SEMANTIC_SIMILARITY: ████FRAMING_AXIS_3: ████NOVELTY_SCORE: ██.█AFFECT_DELTA: ████CONSENSUS: █/█ENTROPY: ██.██REPETITION_INDEX: ████PROVISION_DRIFT: ██.█σRHETORICAL_VELOCITY: ████MODEL_VARIANCE: ████STATEMENT_COUNT: ████CONVERGENCE_RATIO: █.██SEMANTIC_SIMILARITY: ████FRAMING_AXIS_3: ████NOVELTY_SCORE: ██.█AFFECT_DELTA: ████CONSENSUS: █/█ENTROPY: ██.██REPETITION_INDEX: ████PROVISION_DRIFT: ██.█σRHETORICAL_VELOCITY: ████MODEL_VARIANCE: ████STATEMENT_COUNT: ████CONVERGENCE_RATIO: █.██
SEMANTIC_SIMILARITY: ████FRAMING_AXIS_3: ████NOVELTY_SCORE: ██.█AFFECT_DELTA: ████CONSENSUS: █/█ENTROPY: ██.██REPETITION_INDEX: ████PROVISION_DRIFT: ██.█σRHETORICAL_VELOCITY: ████MODEL_VARIANCE: ████STATEMENT_COUNT: ████CONVERGENCE_RATIO: █.██SEMANTIC_SIMILARITY: ████FRAMING_AXIS_3: ████NOVELTY_SCORE: ██.█AFFECT_DELTA: ████CONSENSUS: █/█ENTROPY: ██.██REPETITION_INDEX: ████PROVISION_DRIFT: ██.█σRHETORICAL_VELOCITY: ████MODEL_VARIANCE: ████STATEMENT_COUNT: ████CONVERGENCE_RATIO: █.██
The system measures. It does not judge.
™ SURFACES
CLASSIFIED▸ CLEARANCE REQUIRED
Baseline™CORE
Pure signal. No noise.
▸ CLEARANCE REQUIRED
The measurement stack. Parallel AI systems, side-by-side results, source context on every surface.
RCPT-TML // PATTERN MEMORY
CLASSIFIED▸ CLEARANCE REQUIRED
The Receipt™CORE
Recurring patterns. Measured over time.
▸ CLEARANCE REQUIRED
Match tiers surface the strongest patterns. History doesn’t disappear.
CLASSIFIED▸ CLEARANCE REQUIRED
Signal Pulse™CORE
The signal at a glance.
▸ CLEARANCE REQUIRED
Visual summary of signal activity. No analysis required to read it.
FRM-FPR // IDENTITY SIGNATURE
CLASSIFIED▸ CLEARANCE REQUIRED
Framing Fingerprint™CORE
A figure’s rhetorical identity.
▸ CLEARANCE REQUIRED
Aggregate framing tendencies rendered as a unique visual signature.
FRM-RDR // 5-AXIS PENTAGON
CLASSIFIED▸ CLEARANCE REQUIRED
Framing Radar™PRO
Five axes. One pentagon. Every model.
▸ CLEARANCE REQUIRED
Overlay the models and the structure of the statement reveals itself.
LNS-LAB // 3-SYS PARALLEL
CLASSIFIED▸ CLEARANCE REQUIRED
Lens Lab™PRO
Independent systems. Side-by-side. You decide.
▸ CLEARANCE REQUIRED
Consensus is computed after, displayed alongside, never merged.
CLASSIFIED▸ CLEARANCE REQUIRED
Crossfire™PRO
Two figures. One surface. Direct comparison.
▸ CLEARANCE REQUIRED
Side-by-side framing comparison across any two tracked figures.
CLASSIFIED▸ CLEARANCE REQUIRED
Constellation Nav™PRO
Navigate the network.
▸ CLEARANCE REQUIRED
Explore connections between figures, topics, and framing patterns.
CLASSIFIED▸ CLEARANCE REQUIRED
Provision Drift™PRO
How far did it drift?
▸ CLEARANCE REQUIRED
Measures semantic distance between provisions and a bill’s stated purpose.
CLASSIFIED▸ CLEARANCE REQUIRED
Split Microscope™PRO+
Where models diverge.
▸ CLEARANCE REQUIRED
Detailed variance breakdown when independent systems disagree.
XSCT-PNL // LINK TOPOLOGY
CLASSIFIED▸ CLEARANCE REQUIRED
Intersections Panel™PRO+
Cross-linking patterns.
▸ CLEARANCE REQUIRED
Shows shared framing and topic overlaps across figures and time.
DCLS-DSR // EXHIBIT PLATE
CLASSIFIED▸ CLEARANCE REQUIRED
Declassified Dossier™PRO+
The full exhibit plate.
▸ CLEARANCE REQUIRED
Complete analytical profile for a single figure. Every surface, one view.
MTN-TML // GENOME SPECIMEN
CLASSIFIED▸ CLEARANCE REQUIRED
Mutation Timeline™PRO+
The legislative genome, sequenced.
▸ CLEARANCE REQUIRED
How bill provisions change across legislative versions. Each mutation measured, each splice detected.
CLASSIFIED▸ CLEARANCE REQUIRED
Spending Scope™PRO+
Fiscal depth, measured.
▸ CLEARANCE REQUIRED
Spending data tied to bills and provisions. CBO scores, extracted figures, every dollar surfaced.
NRT-SYN // CONVERGENCE DETECTION
CLASSIFIED▸ CLEARANCE REQUIRED
Narrative Sync™B2B
Cross-figure framing convergence.
▸ CLEARANCE REQUIRED
Detects when independent figures begin using similar framing simultaneously.
Observational analysis only. Not a fact-check.

